This recently released paper is very compelling in that it is able to assign the observed temperature data to the Pacific Decadal Oscillation (PDO). It should have always been a priority to establish the importance of this variable, simply because the Pacific represents a uniform surface covering half the globe. Anything happening there in the atmosphere must naturally be the most significant atmospheric effect and we have already had El Nino and La Nino to integrate into our models.
Suddenly, this work reveals that the Northern Hemispheric warming that we have experienced over the past two decades is linked directly to shifts in the Pacific that make convincing sense and could even be anticipated. This is the natural driver of normal climate variation which we certainly have not broken out of at all.
This paper is critical of the IPCC modeling and proves that it is rubbish through a well developed critique, including a challenge to show him wrong.
We are going from an unconvincing argument for CO2 forcing to a sound demonstration that its effect is minor. It is time for the enthusiasts to beat a retreat before Mother Nature shows up at the party and ruins it all. Of course we will then hear extensively from the sunspot crowd.
The evidence supported a decadal shifting of heat back and forth across the equator in one way or the other and that makes a great deal of sense because it gives the Earth a mechanism with which to keep the heat content of the globe in balance. Otherwise we need to rely on a centuries’ long cycle that readjusts the ocean currents. It is simply too slow.
I now feel that we are getting a real handle on the climatic levers and switches. Now if I could figure out which North Pacific volcano caused the Little Ice Age we would be almost home free.
Global Warming as a Natural Response to Cloud Changes Associated with the Pacific Decadal Oscillation (PDO)
byRoy W. Spencer, PhD
Principal Research Scientist The University of Alabama in Huntsville (posted October 19, 2008; updated 10/20/08, 6:35 a.m.)
(what follows is a simplified version of a paper I am preparing for submission to Geophysical Research Letters)
Abstract
A simple climate model forced by satellite-observed changes in the Earth's radiative budget associated with the Pacific Decadal Oscillation is shown to mimic the major features of global average temperature change during the 20th Century - including two-thirds of the warming trend. A mostly-natural source of global warming is also consistent with mounting observational evidence that the climate system is much less sensitive to carbon dioxide emissions than the IPCC's climate models simulate.
1. Introduction
For those who have followed my writings and publications in the last 18 months (e.g. Spencer et al., 2007), you know that we are finding satellite evidence that the climate system could be much less sensitive to greenhouse gas emissions than the U.N.'s Intergovernmental Panel on Climate Change (IPCC, 2007) climate models suggest.
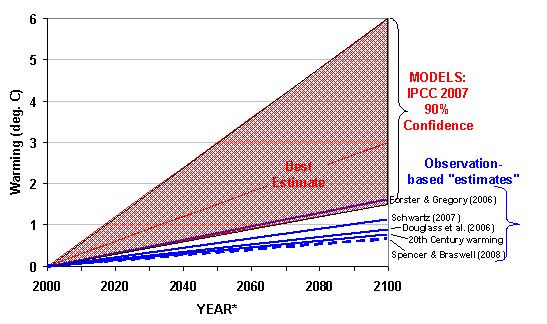
To show that we are not the only researchers who have documented evidence contradicting the IPCC models, I made the following figure to contrast the IPCC-projected warming from a doubling of atmospheric carbon dioxide with the warming that would result if the climate sensitivity is as low as implied by various kinds of observational evidence.
Fig. 1. Projected warming (assumed here to occur by 2100) from a doubling of atmospheric CO2 from the IPCC climate models versus from various observational
indicators.
http://www.weatherquestions.com/PDO-and-20th-Century-warming-Fig01.jpg
The dashed line in Fig. 1 comes from our recent apples-to-apples comparison between satellite-based feedback estimates and IPCC model-diagnosed feedbacks, all computed from 5-year periods (Spencer and Braswell, 2008a). In that comparison, there were NO five year periods from ANY of the IPCC model simulations which produced a feedback parameter with as low a climate sensitivity as that found in the satellite data.
The discrepancy between the models and observations seen in Fig. 1 is stark. If the sensitivity of the climate system is as low as some of these observational results suggest, then the IPCC models are grossly in error, and we have little to fear from manmade global warming. [I am told that the 1.1 deg. C sensitivity of Schwartz (2007) has more recently been revised upward to 1.9 deg. C.]
But an insensitive climate system would ALSO mean that the warming we have seen in the last 100 years can not be explained by increasing CO2 alone. This is because the radiative forcing from the extra CO2 would simply be too weak to cause the ~0.7 deg. C warming between 1900 and 2000... there must be some natural warming process going on as well.
Here I present new evidence that most of the warming could actually be the result of a natural cycle in cloud cover forced by a well-known mode of natural climate variability: the Pacific Decadal Oscillation.
2. A Simple Model of Natural Global Warming
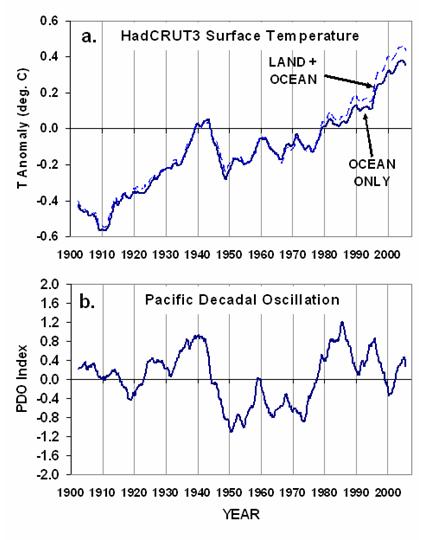
As Joe D'Aleo and others have pointed out for years, the Pacific Decadal Oscillation (PDO) has experienced phase shifts that coincided with the major periods of warming and cooling in the 20th Century. As can be seen in the following figure, the pre-1940 warming coincided with the positive phase of the PDO; then, a slight cooling until the late 1970s coincided with a negative phase of the PDO; and finally, the warming since the 1970s has once again coincided with the positive phase of the PDO.
Fig. 2. Five-year running averages in (a) global-average surface temperature, and (b) the Pacific Decadal Oscillation (PDO) index during 1900-2000.
http://www.weatherquestions.com/PDO-and-20th-Century-warming-Fig02.jpg
Others have noted that the warming in the 1920s and 1930s led to media reports of decreasing sea ice cover, Arctic and Greenland temperatures just as warm as today, and the opening up of the Northwest Passage in 1939 and 1940.
Since this timing between the phase of the PDO and periods of warming and associated climate change seems like more than mere coincidence, I asked the rather obvious question: What if this known mode of natural climate variability (the PDO) caused a small fluctuation in global-average cloud cover?
Such a cloud change would cause the climate system to go through natural fluctuations in average temperature for extended periods of time. The IPCC simply assumes that this kind of natural cloud variability does not exist, and that the Earth stays in a perpetual state of radiative balance that has only been recently disrupted by mankind's greenhouse gas emissions. This is an assumption that many of us meteorologists find simplistic and dubious, at best.
I used a very simple energy balance climate model, previously suggested to us by Isaac Held and Piers Forster, to investigate this possibility. In this model I ran many thousands of combinations of assumed: (1) ocean depth (through which heat is mixed on multi-decadal to centennial time scales), (2) climate sensitivity, and (3) cloud cover variations directly proportional to the PDO index values.
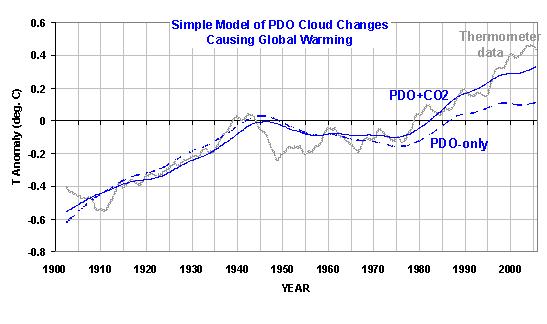
In effect, I asked the model to show me what combinations of those model parameters yielded a temperature history approximately like that seen during 1900-2000. And here's an average of all of the simulations that came close to the observed temperature record:
Fig. 3. A simple energy balance model driven by cloud changes associated with the PDO can explain most of the major features of global-average temperature fluctuations during the 20th Century. The best model fits had assumed ocean mixing depths around 800 meters, and feedback parameters of around 3 Watts per square meter per degree C.
http://www.weatherquestions.com/PDO-and-20th-Century-warming-Fig03.jpg
The "PDO-only" (dashed) curve indeed mimics the main features of the behavior of global mean temperatures during the 20th Century -- including two-thirds of the warming trend. If I include transient CO2 forcing with the PDO-forced cloud changes (solid line labeled PDO+CO2), then the fit to observed temperatures is even closer. It is important to point out that, in this exercise, the PDO itself is not an index of temperature; it is an index of radiative forcing which drives the time rate of change of temperature. Now, the average PDO forcing that was required by the model for the two curves in Fig. 3 ranged from 1.7 to 2.0 Watts per square meter per PDO index value. In other words, for each unit of the PDO index, 1.7 to 2.0 Watts per square meter of extra heating was required during the positive phase of the PDO, and that much cooling during the negative phase of the PDO.
But what evidence do we have that any such cloud-induced changes in the Earth's radiative budget are actually associated with the PDO? I address that question in the next section
3. Satellite Evidence for Radiative Budget Changes Forced by the Pacific Decadal Oscillation
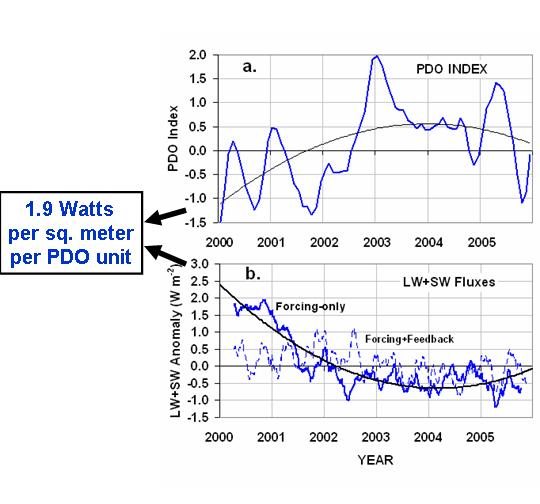
To see whether there is any observational evidence that the PDO has associated changes in global-average cloudiness, I used NASA Terra satellite measurements of reflected solar (shortwave, SW) and emitted infrared (longwave, LW) radiative fluxes over the global oceans from the CERES instrument during 2000-2005, and compared them to recent variations in the PDO index. The results can be seen in the following figure:
Fig. 4. Three-month running averages of (a) the PDO index during 2000-2005, and (b) corresponding CERES-measured anomalies in the global ocean average radiative budget, with and without the feedback component removed (see Fig. 5). The smooth curves are 2nd order polynomial fits to the data.
http://www.weatherquestions.com/PDO-and-20th-Century-warming-Fig04.jpg
But before a comparison to the PDO can be made, one must recognize that the total radiative flux measured by CERES is a combination of forcing AND feedback (e.g. Gregory et al., 2002; Forster and Gregory, 2006). So, we first must estimate and remove the feedback component to better isolate any radiative forcing potentially associated with the PDO.
As Spencer and Braswell (2008b) have shown with a simple model, the radiative feedback signature in globally-averaged radiative flux-versus-temperature data is always highly correlated, while the time-varying radiative forcing signature of internal climate fluctuations is uncorrelated because the forcing and temperature response are always 90 degrees out of phase. This allows some measure of identification and separation of the two signals.
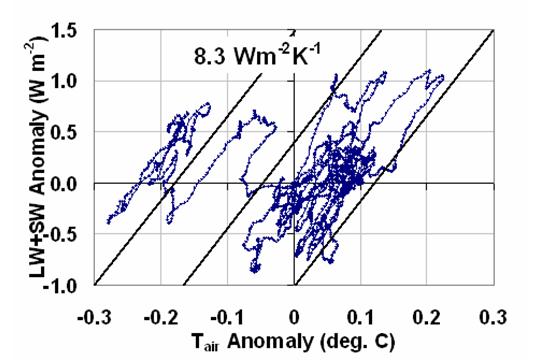
The following figure shows what I call "feedback stripes" associated with intraseasonal fluctuations in the climate system. The corresponding feedback estimate (line slope) of 8.3 Watts per square meter per degree C was then used together with three-month anomalies in tropospheric temperature from AMSU channel 5 remove the estimated feedback signal from the radiative flux data to get the "forcing-only" curve in Fig. 4b.
Fig. 5. Three-month running averages of global oceanic CERES radiative flux changes versus tropospheric temperature changes (from AMSU channel 5, see Christy et al., 2003) for the time period in Fig. 4. The average feedback estimate (see sloped lines) was then used together with the AMSU5 data to estimate and remove the feedback component from the CERES radiative fluxes, leaving the radiative forcing shown in Fig. 4b.
[NOTE: This feedback estimate is not claimed to necessarily represent long-term climate sensitivity (which in this case would be very low, 0.44 deg. C); it is instead the feedback occurring on intraseasonal and interannual time scales which is merely being removed to isolate the forcing signal. It should be remembered that, according to our current paradigm of climate variability, there can only be two sources of radiative variability: forcing and feedback. As shown by Spencer and Braswell (2008a, 2008b), the usual practice of fitting a regression line to all of the data in Fig. 5 would result in a regression slope biased toward zero (high sensitivity) because the presence of any time-varying internal radiative forcing -- which is always occurring -- would be mistakenly included as part of the feedback
When the feedback is removed, we see a good match in signal.] Fig. 4 between the low-frequency behavior of the PDO and the radiative forcing (which is presumably due to cloud fluctuations associated with the PDO). Second-order polynomials were fit to the time series in Fig. 4 and compared to each other to arrive at the PDO-scaling factor of 1.9 Watts per square meter per PDO index value.
It is significant that the observed scale factor (1.9) that converts the PDO index into units of heating or cooling is just what the model required (1.7 to 2.0) to best explain the temperature behavior during the 20th Century. Thus, these recent satellite measurements - even though they span less than 6 years -- support the Pacific Decadal Oscillation as a potential major player in global warming and climate change.
4. Discussion & Conclusions
The evidence continues to mount that the IPCC models are too sensitive, and therefore produce too much global warming. If climate sensitivity is indeed considerably less than the IPCC claims it to be, then increasing CO2 alone can not explain recent global warming. The evidence presented here suggests that most of that warming might well have been caused by cloud changes associated with a natural mode of climate variability: the Pacific Decadal Oscillation.
The IPCC has simply assumed that mechanisms of climate change like that addressed here do not exist. But that assumption is quite arbitrary and, as shown here, very likely wrong. My use of only PDO-forced variations in the Earth's radiative energy budget to explain two-thirds of the global warming trend is no less biased than the IPCC's use of carbon dioxide to explain global warming without accounting for natural climate variability. If any IPCC scientists would like to dispute that claim, please e-mail me at roy.spencer (at) nsstc.uah.edu.
If the PDO has recently entered into a new, negative phase, then we can expect that global average temperatures, which haven't risen for at least seven years now, could actually start to fall in the coming years. The recovery of Arctic sea ice now underway might be an early sign that this is indeed happening.
I am posting this information in advance of publication because of its potential importance to pending EPA regulations or congressional legislation which assume that carbon dioxide is a major driver of climate change. Since the mainstream news media now refuse to report on peer-reviewed scientific articles which contradict the views of the IPCC, Al Gore, and James Hansen, I am forced to bypass them entirely.
We need to consider the very real possibility that carbon dioxide - which is necessary for life on Earth and of which there is precious little in the atmosphere - might well be like the innocent bystander who has been unjustly accused of a crime based upon little more than circumstantial evidence.
REFERENCESChristy, J. R., R. W. Spencer, W. B. Norris, W. D. Braswell, and D. E. Parker (2003), Error estimates of version 5.0 of MSU/AMSU bulk atmospheric temperatures, J. Atmos. Oceanic Technol., 20, 613- 629.
Douglass, D.H., and R. S. Knox, 2005. Climate forcing by volcanic eruption of Mount Pinatubo. Geophys. Res. Lett., 32, doi:10.1029/2004GL022119.
Forster, P. M., and J. M. Gregory (2006), The climate sensitivity and its components diagnosed from Earth Radiation Budget data, J. Climate, 19, 39-52.
Gregory, J.M., R.J. Stouffer, S.C.B. Raper, P.A. Stott, and N.A. Rayner (2002), An observationally based estimate of the climate sensitivity, J. Climate, 15, 3117-3121.
Intergovernmental Panel on Climate Change (2007), Climate Change 2007: The Physical Science Basis, report, 996 pp., Cambridge University Press, New York City.
Schwartz, S. E. (2007), Heat capacity, time constant, and sensitivity of the Earth's climate system. J. Geophys. Res., 112, doi:10.1029/2007JD008746.
Spencer, R.W., W. D. Braswell, J. R. Christy, and J. Hnilo (2007), Cloud and radiation budget changes associated with tropical intraseasonal oscillations, Geophys. Res. Lett., 34, L15707, doi:10.1029/2007GL029698.
Spencer, R.W., and W.D. Braswell (2008a), Satellite measurements reveal a climate system less sensitive than in models, Geophys. Res. Lett., submitted.
Spencer, R.W., and W.D. Braswell (2008b), Potential biases in cloud feedback diagnosis: A simple model demonstration, J. Climate, November 1.


No comments:
Post a Comment